Dashboard
Emona MFT Dashboard
One web page for all your Emona MFT servers and clients: who is online, what was sent and when, what failed, how much disk space is left, alerts by e-mail or syslog, and an incident register for every alert.
Version: Emona MFT 1.7.0. Every Emona MFT order includes at least one dashboard instance, and all licensed servers connect to it. The dashboard runs on your own infrastructure; nothing is sent to BLUEGEM or any cloud service, and its licence is checked offline.
How it works
The dashboard is a separate program that you install next to your Emona MFT servers. Each server and client gets its own key and pushes its events and a heartbeat to the dashboard over an encrypted agent link (TCP port 9100 by default). You open the dashboard in a browser.
- Read-only towards servers and clients. The dashboard never changes their settings and never sends them commands. Agents only push; the dashboard answers only with an acknowledgement.
- Never holds up a transfer. If the dashboard can't be reached, events wait in memory (up to 10,000) and are sent when it is back. A stopped dashboard or a wrong key only shows in the log.
- No database, no framework. One JAR, data in plain files on your disk. Agents are added in a simple file, and changes apply without a restart.
- Events are stored once. Each event carries a sequence number, so events sent again after a lost acknowledgement are skipped, also after a crash or restart of the dashboard.
What you see
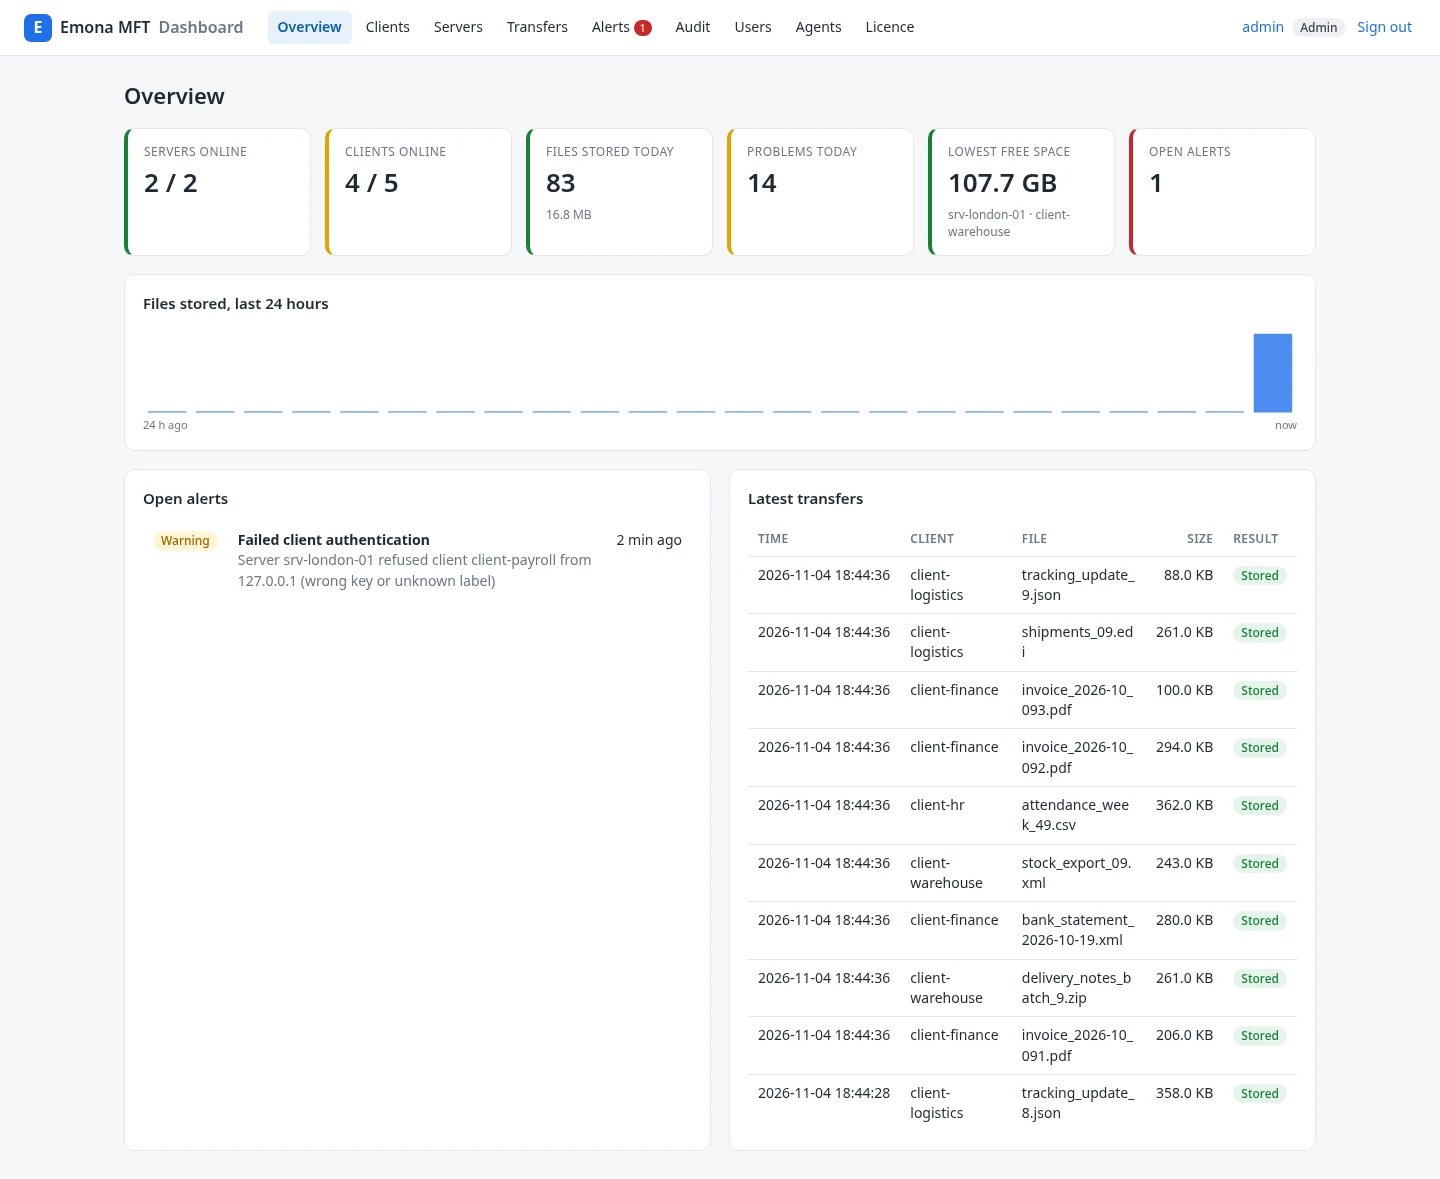
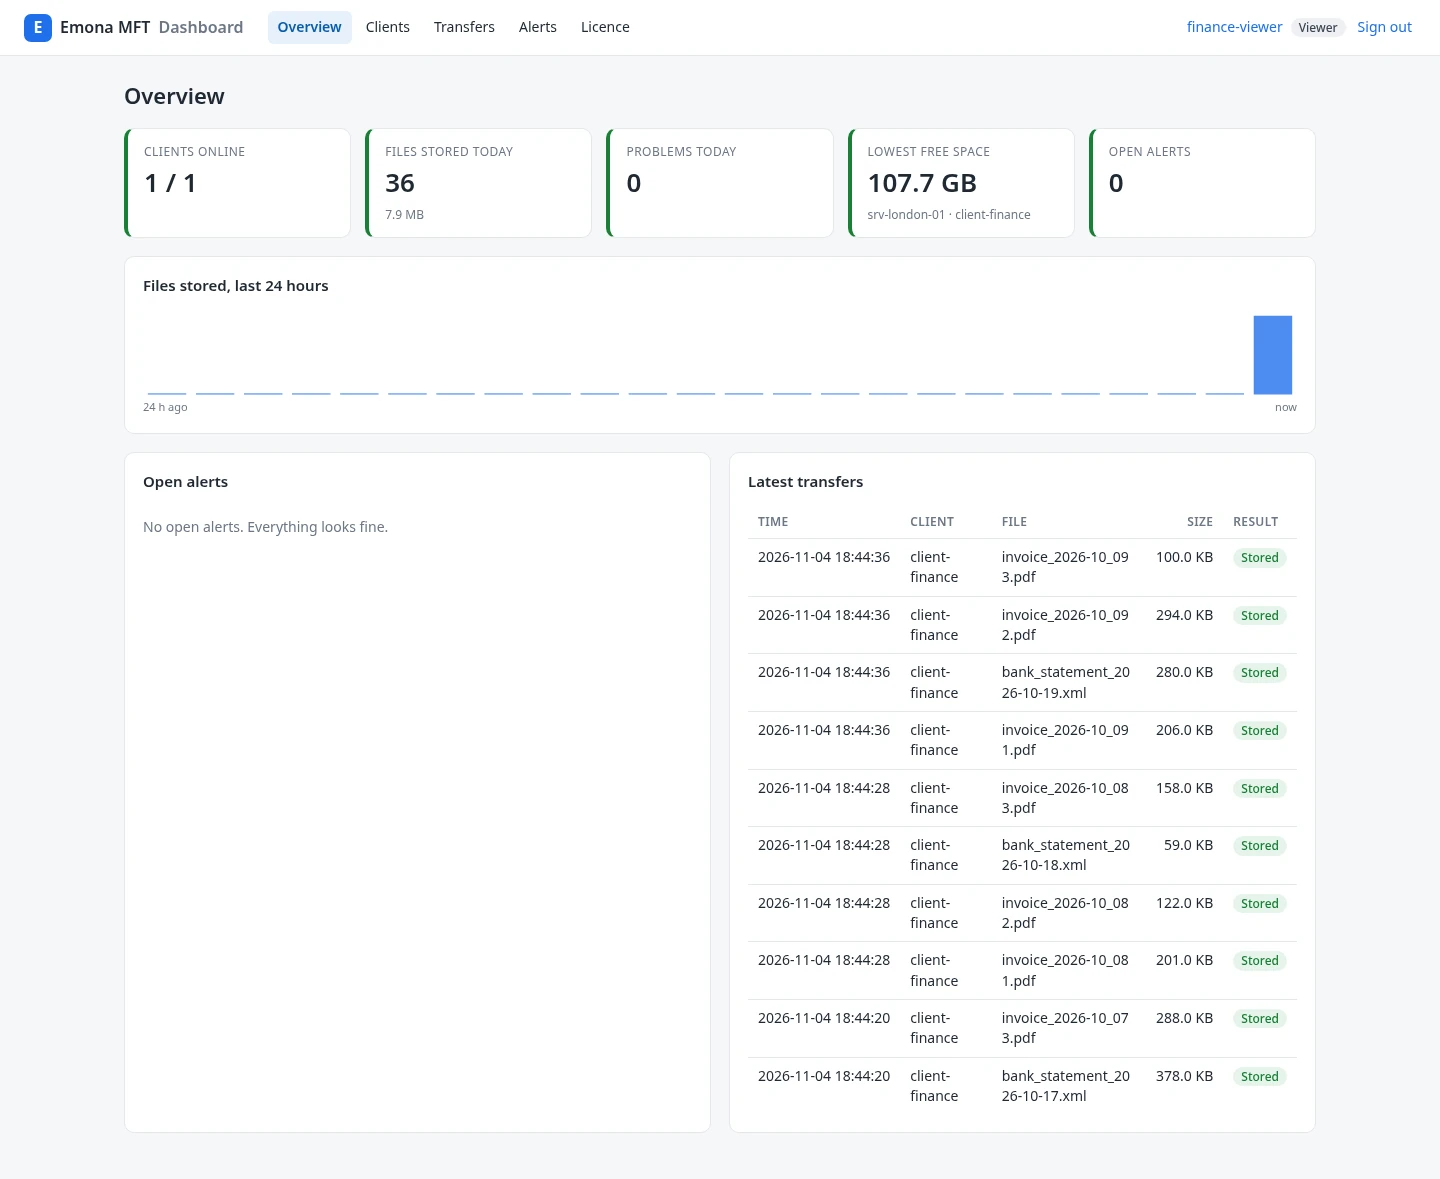
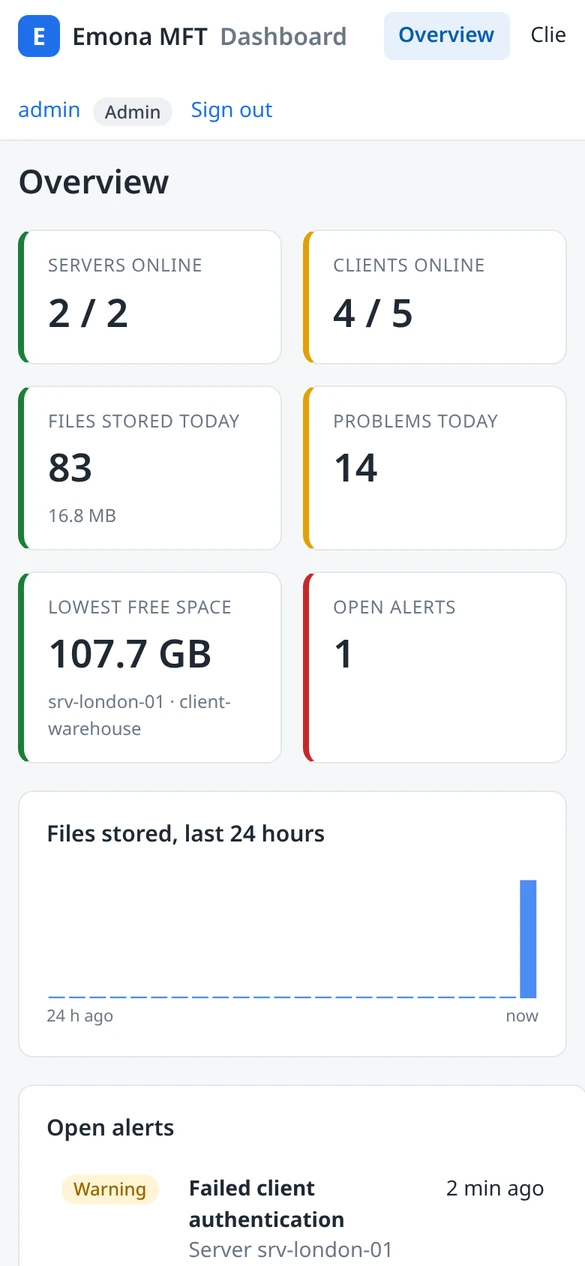
- Overview: servers and clients online, files stored and problems today, the lowest free disk space, open alerts, files stored over the last 24 hours and the latest transfers. Transfer counts are kept per 15 minutes, so the day's totals follow your time zone.
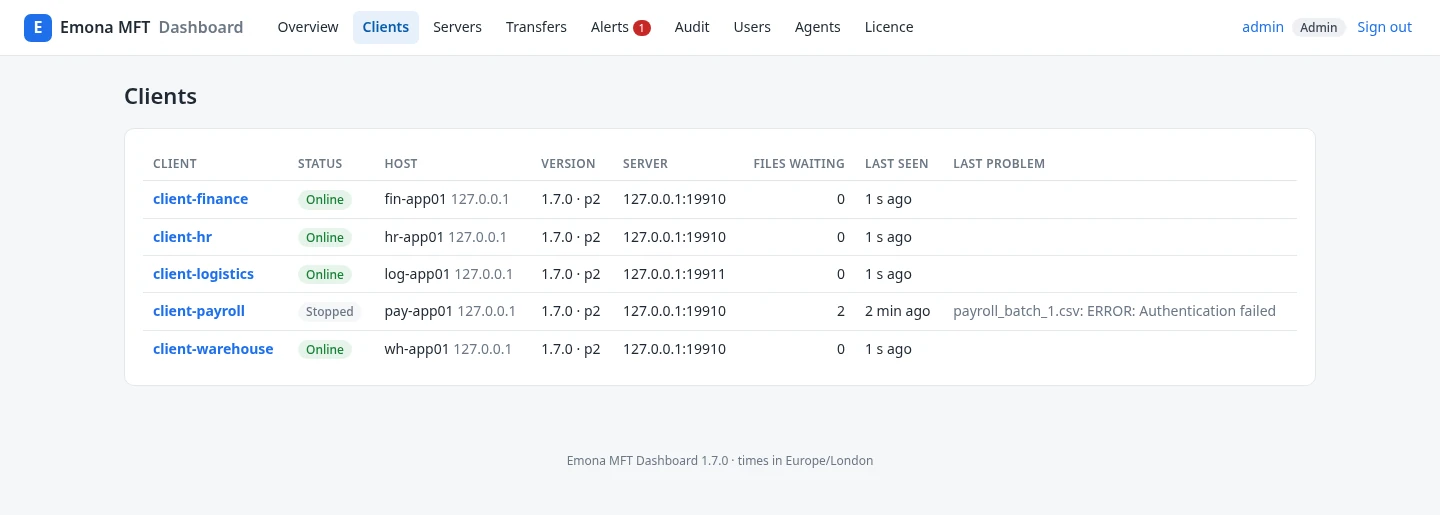
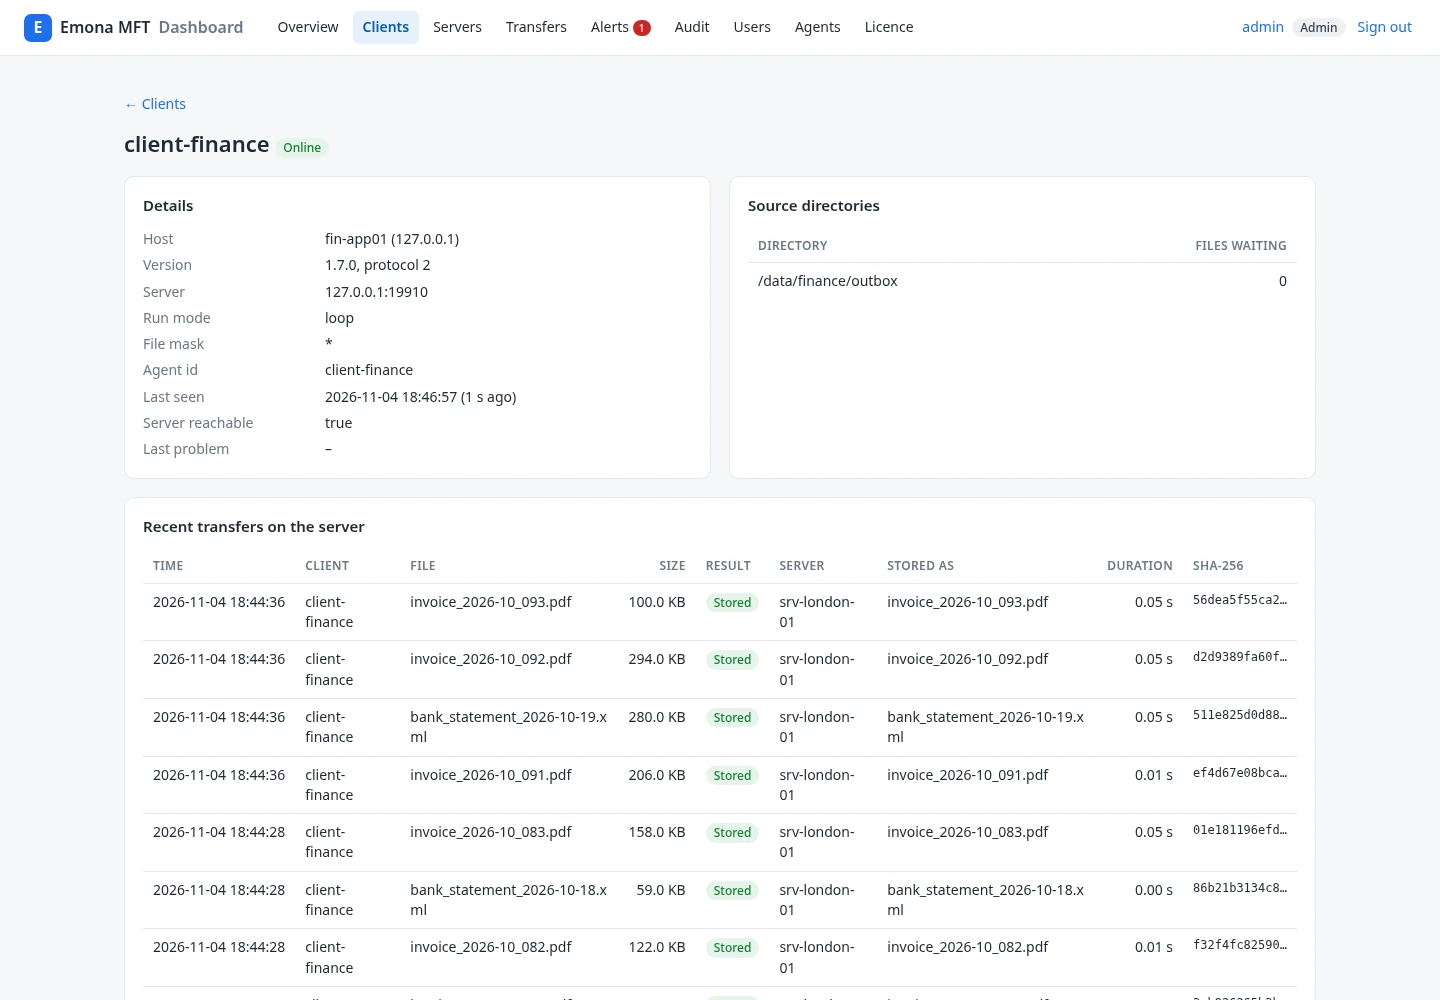
- Clients and client detail: last contact, last file, waiting files, source directories, and files and problems of the last days.
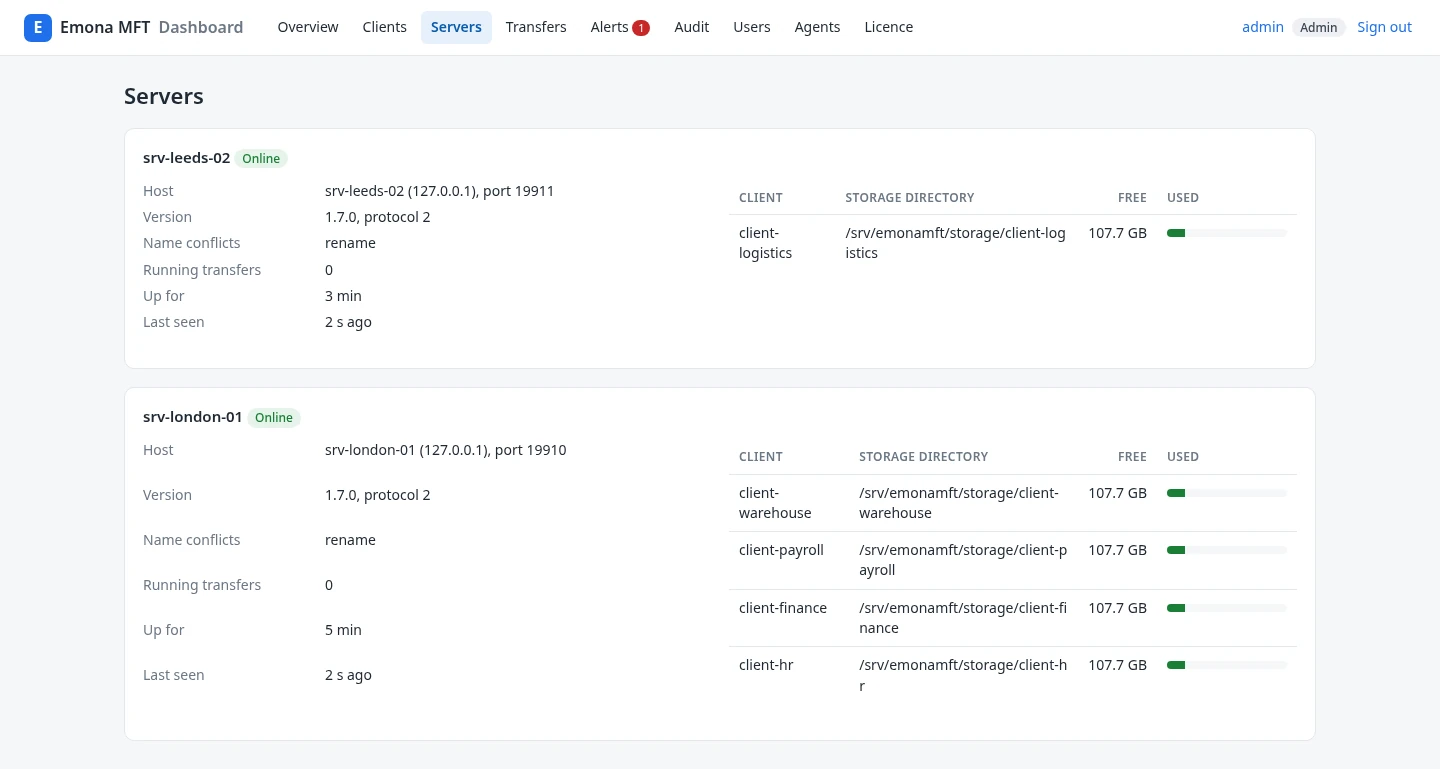
- Servers: storage and free space per client, active transfers and settings.
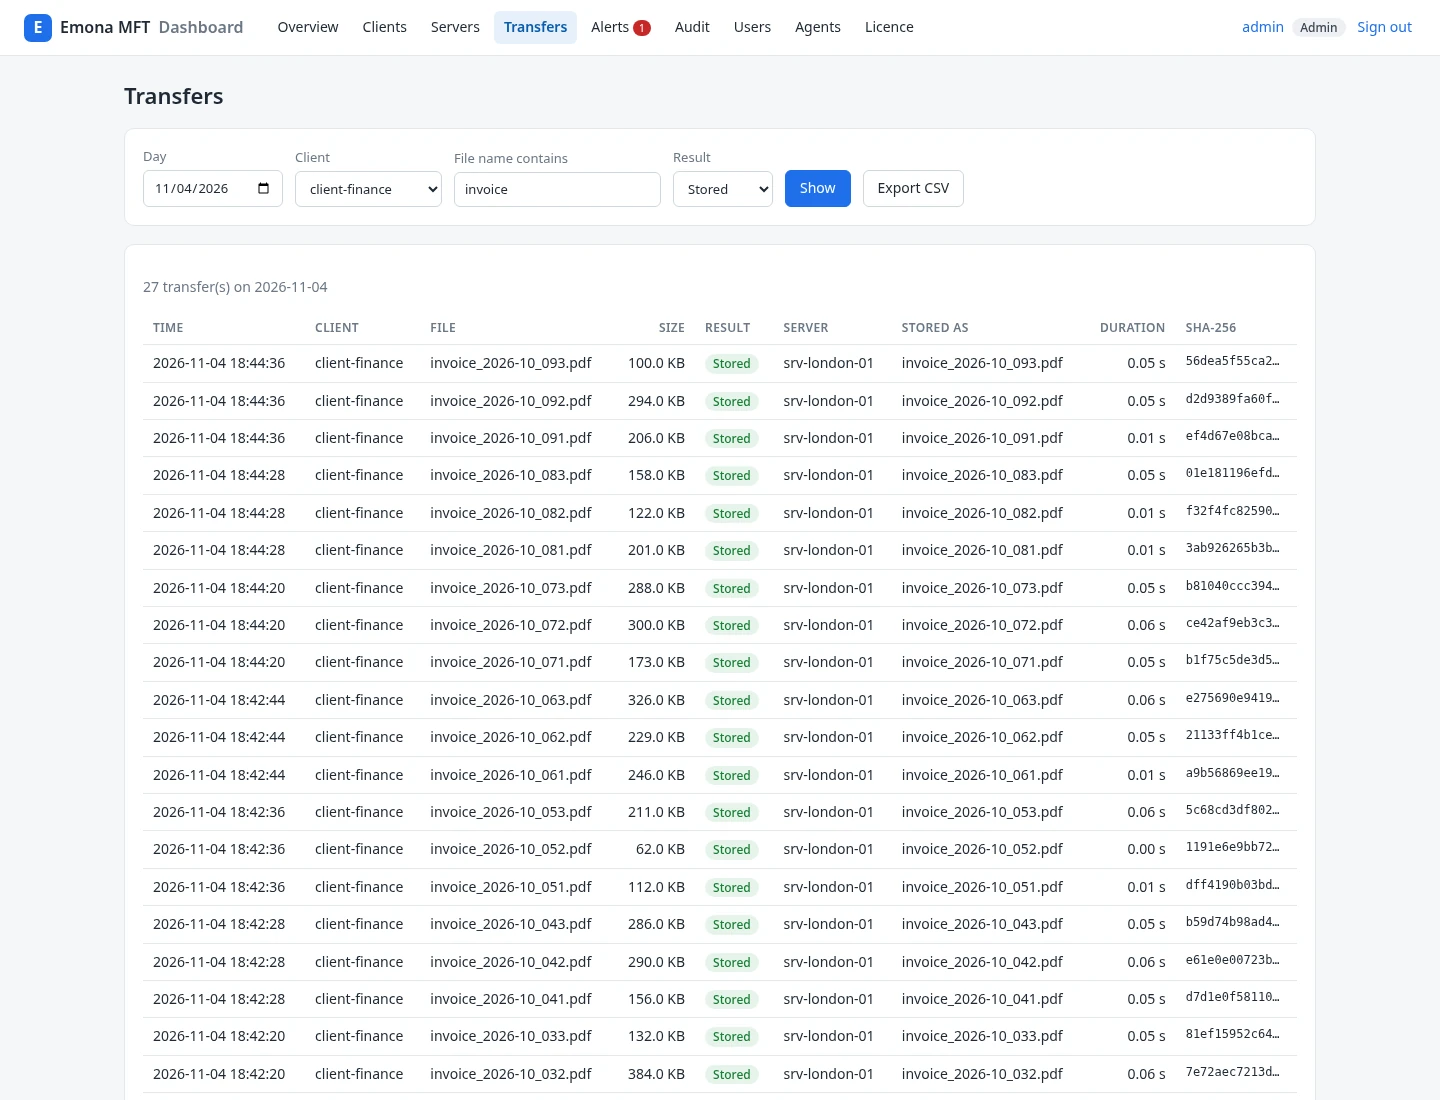
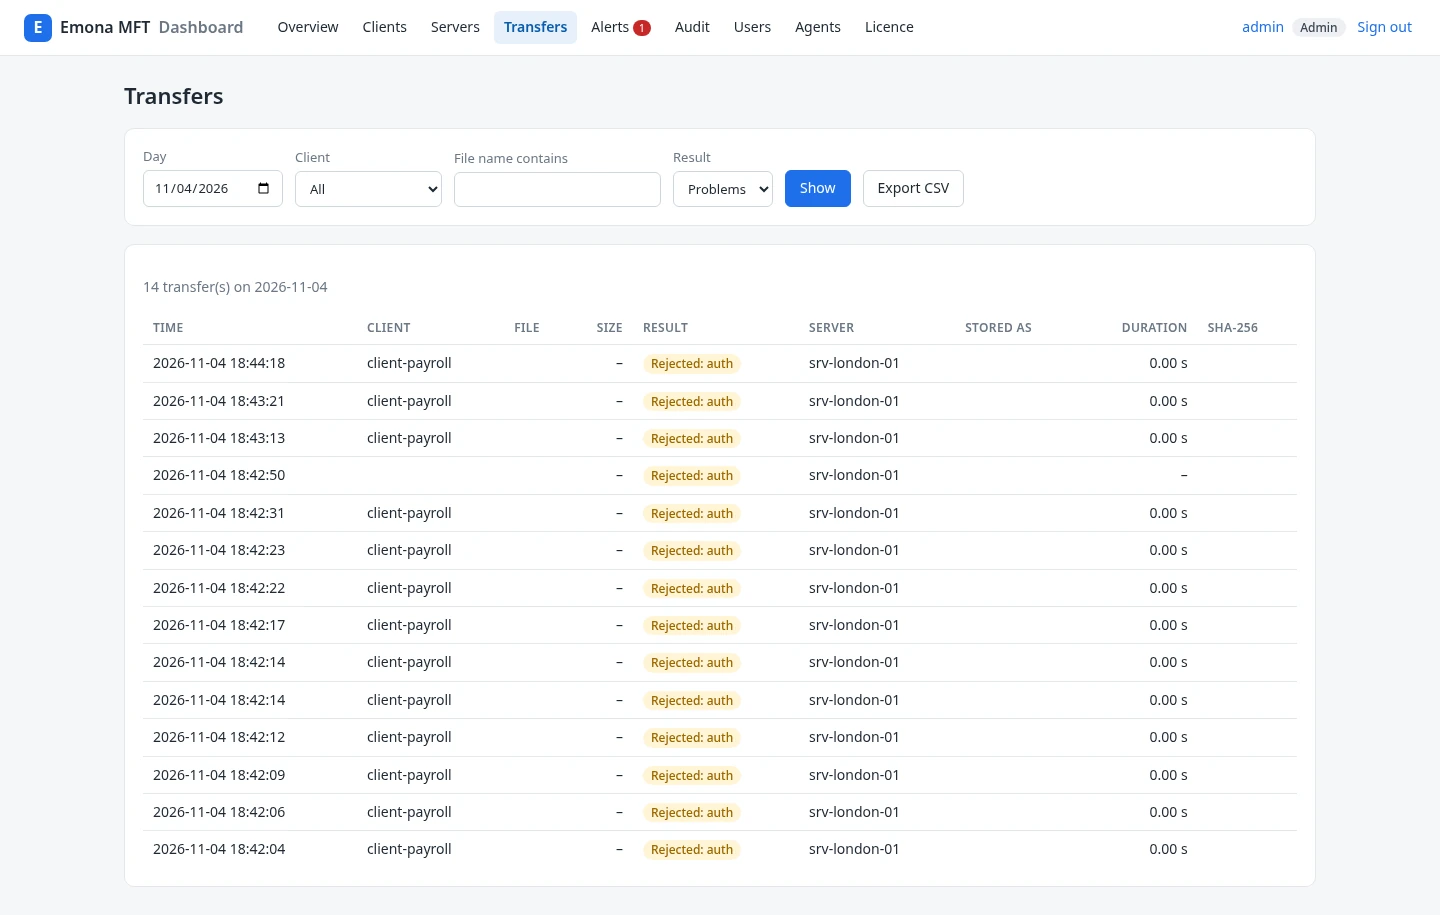
- Transfers: search by day, client, file name and result over all kept days. The page shows the newest 500 transfers of a day together with the day's total, and the CSV export contains all of them.
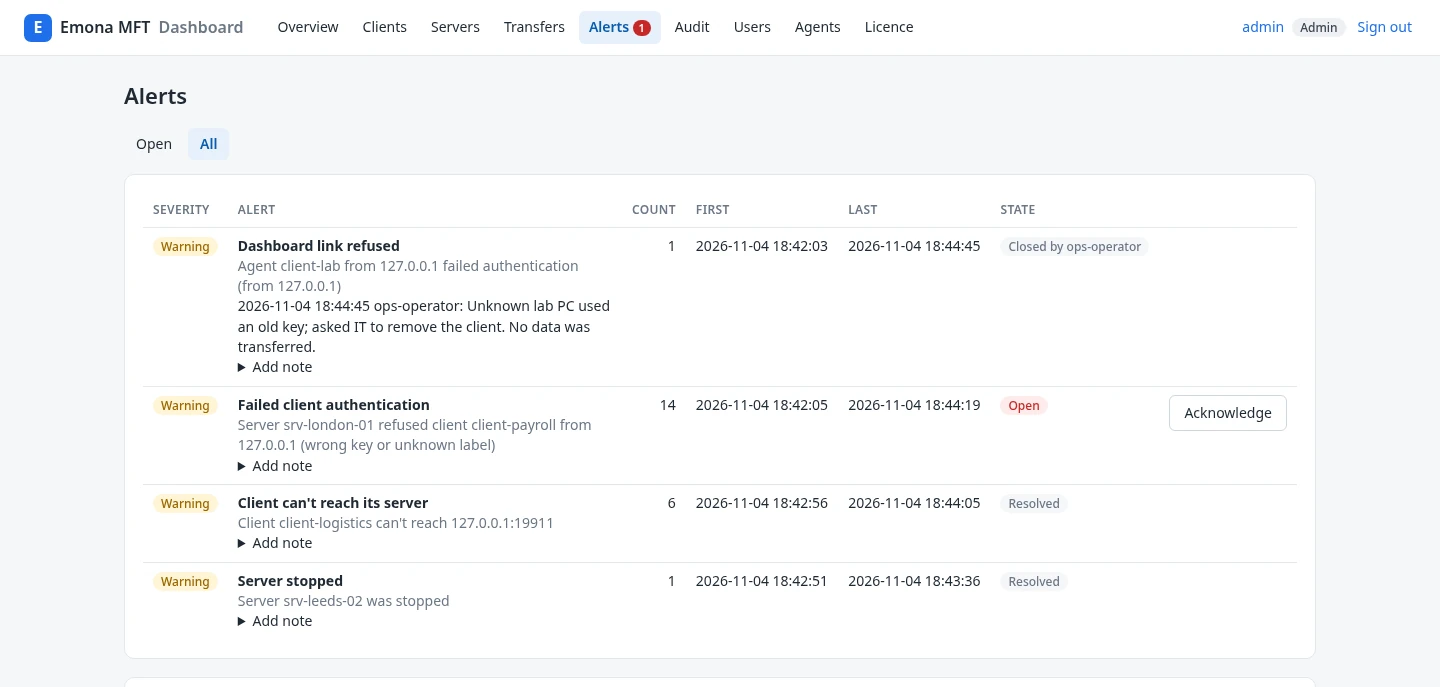
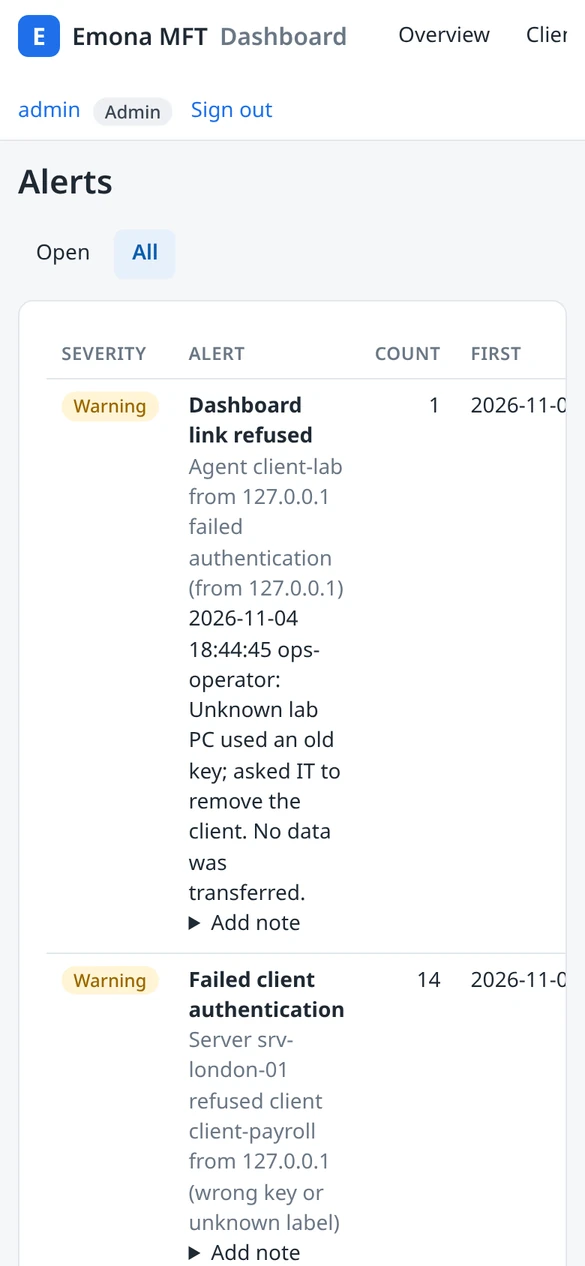
- Alerts: open and past alerts. Operators and admins acknowledge them.
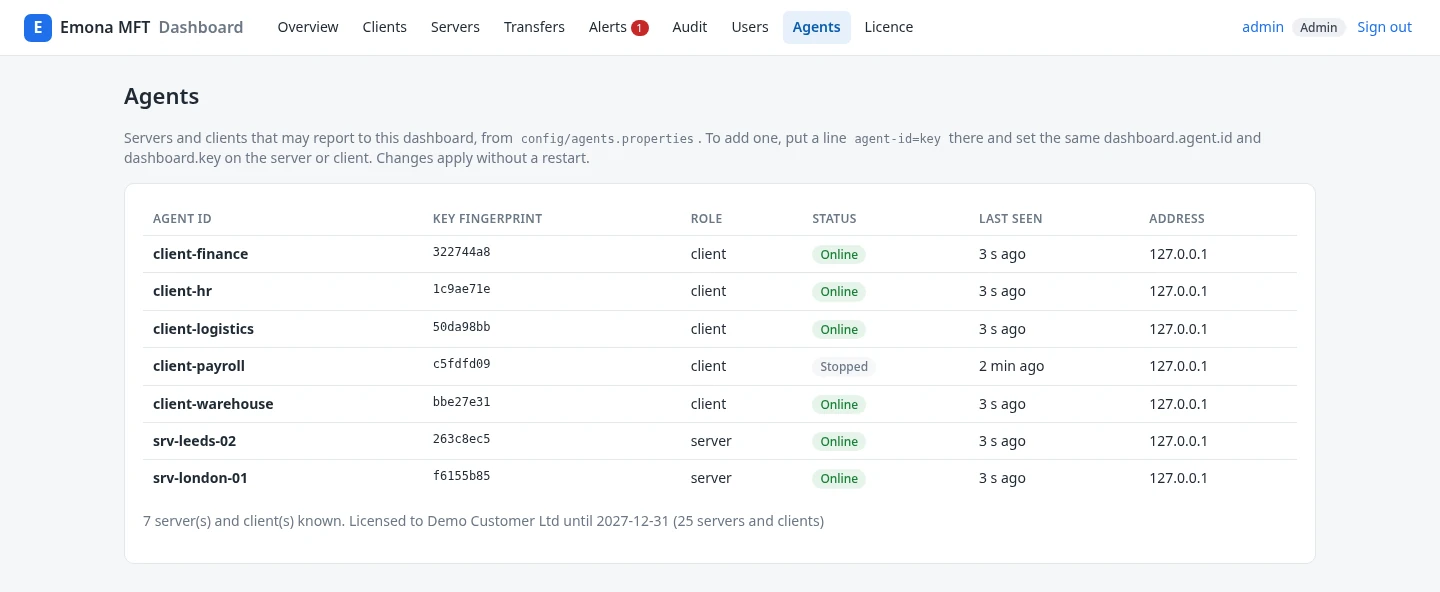
- Agents (admins): every server and client with its agent id, key fingerprint, role, status, last contact and address.
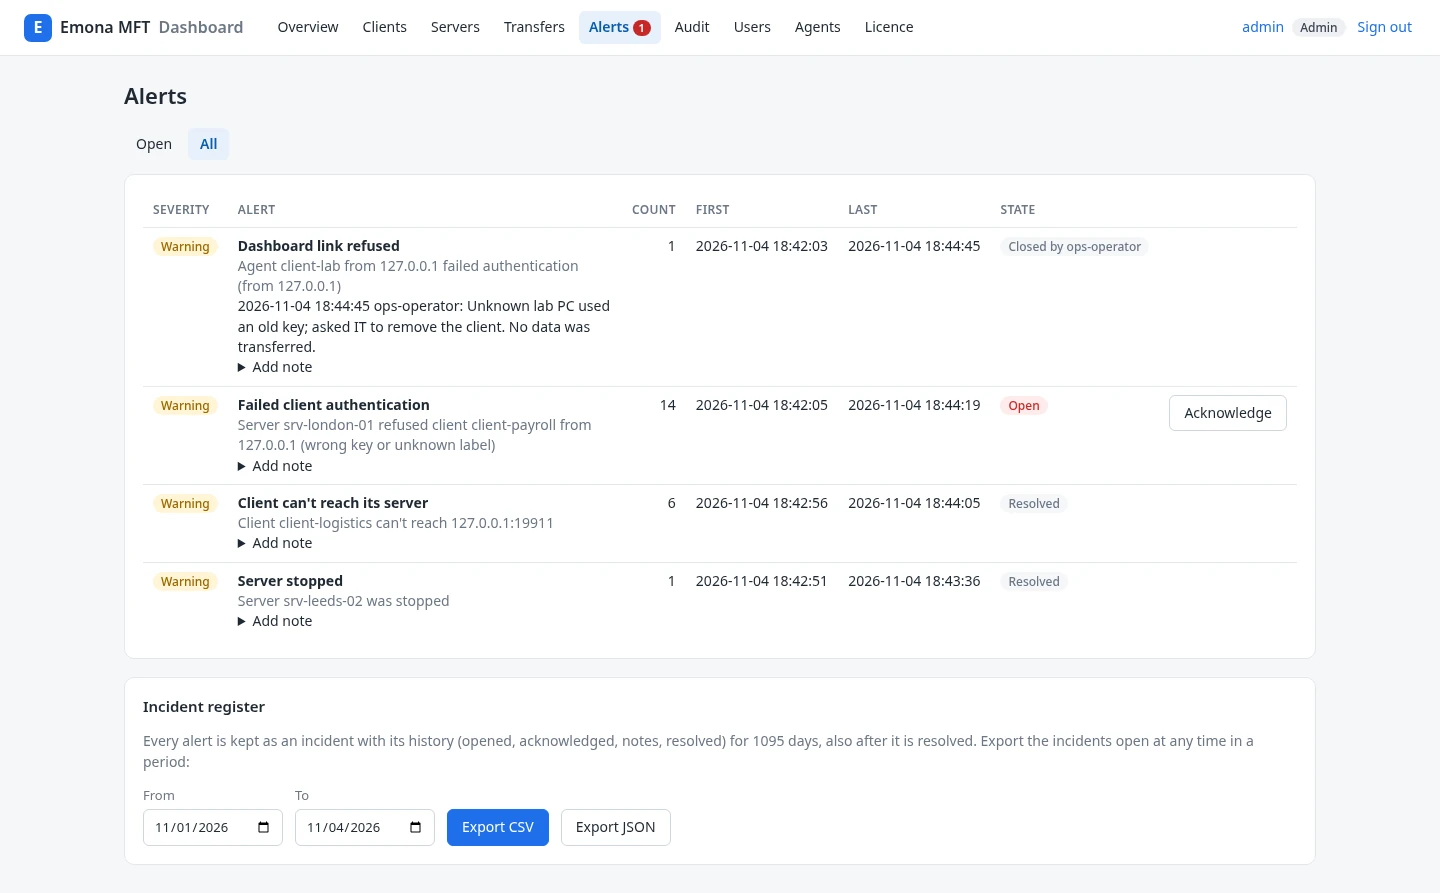
- Incident register: every alert with its acknowledgement, resolution, notes and history, exported for a period as CSV or JSON (admins and auditors).
- Audit, Users, Licence (admins), and Account for every user, with two-factor sign-in.
Pages refresh themselves every 30 seconds.
Screenshots
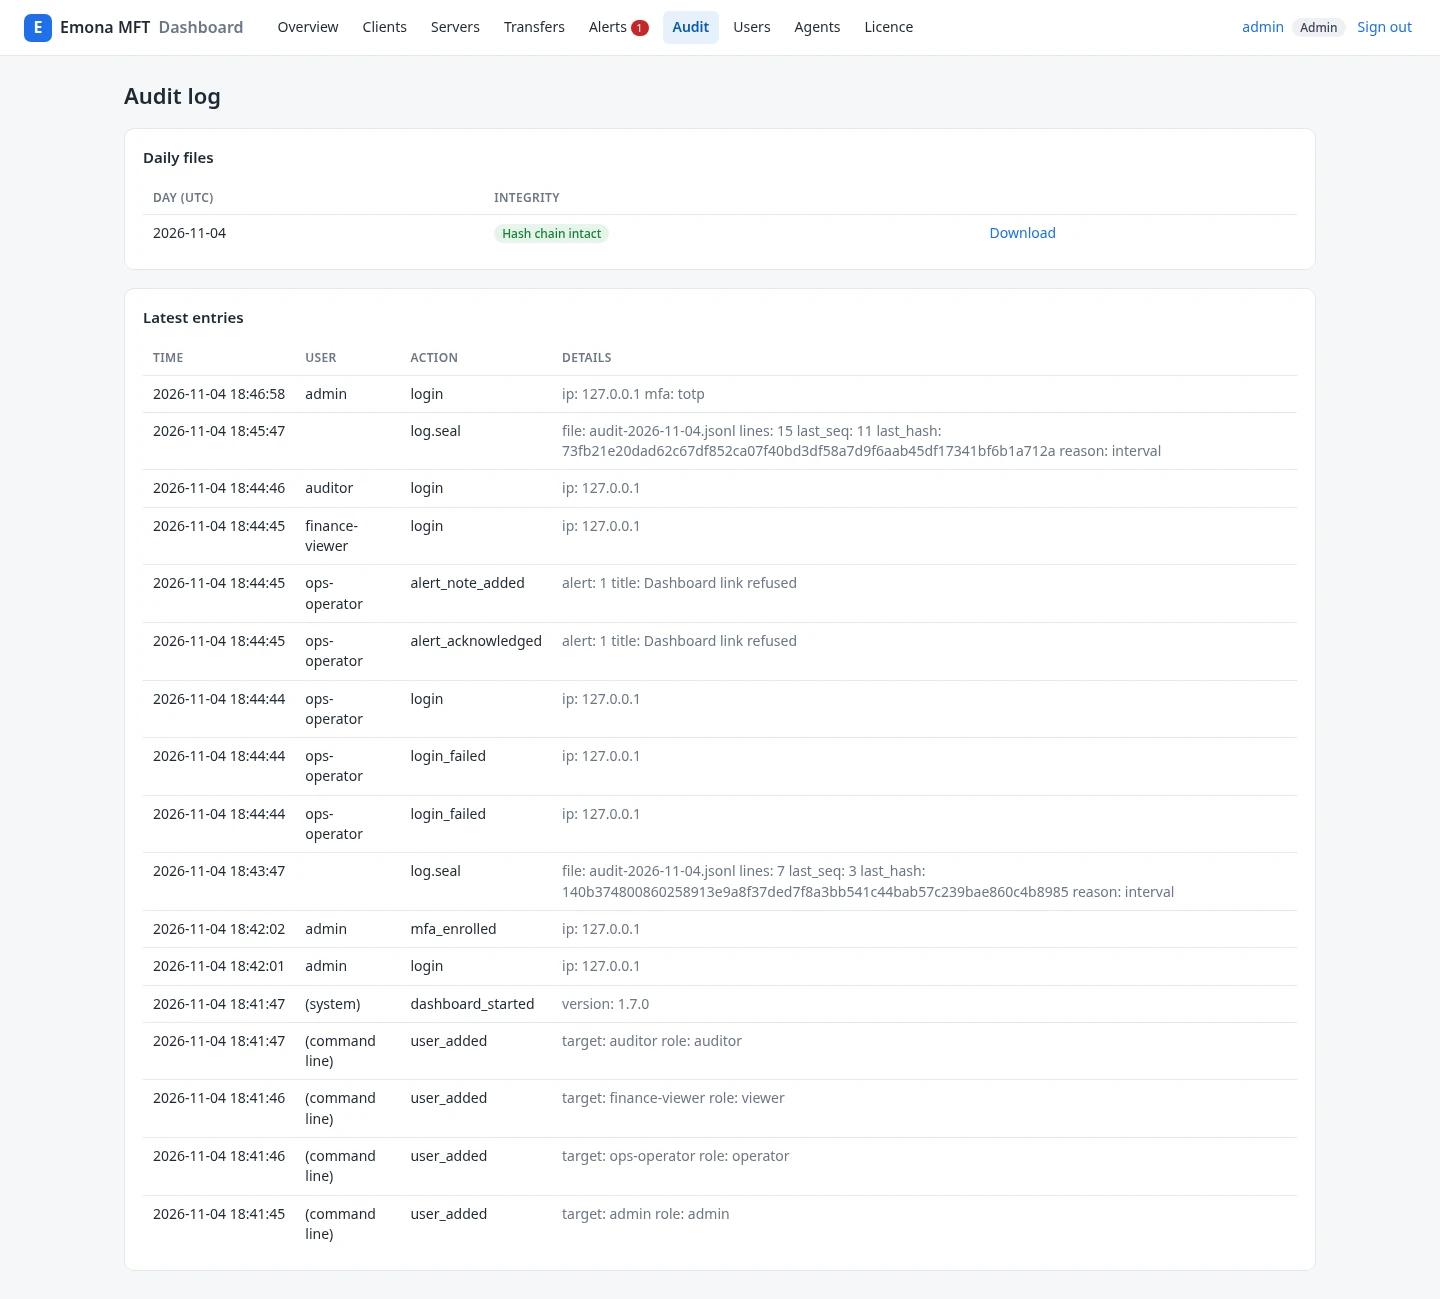
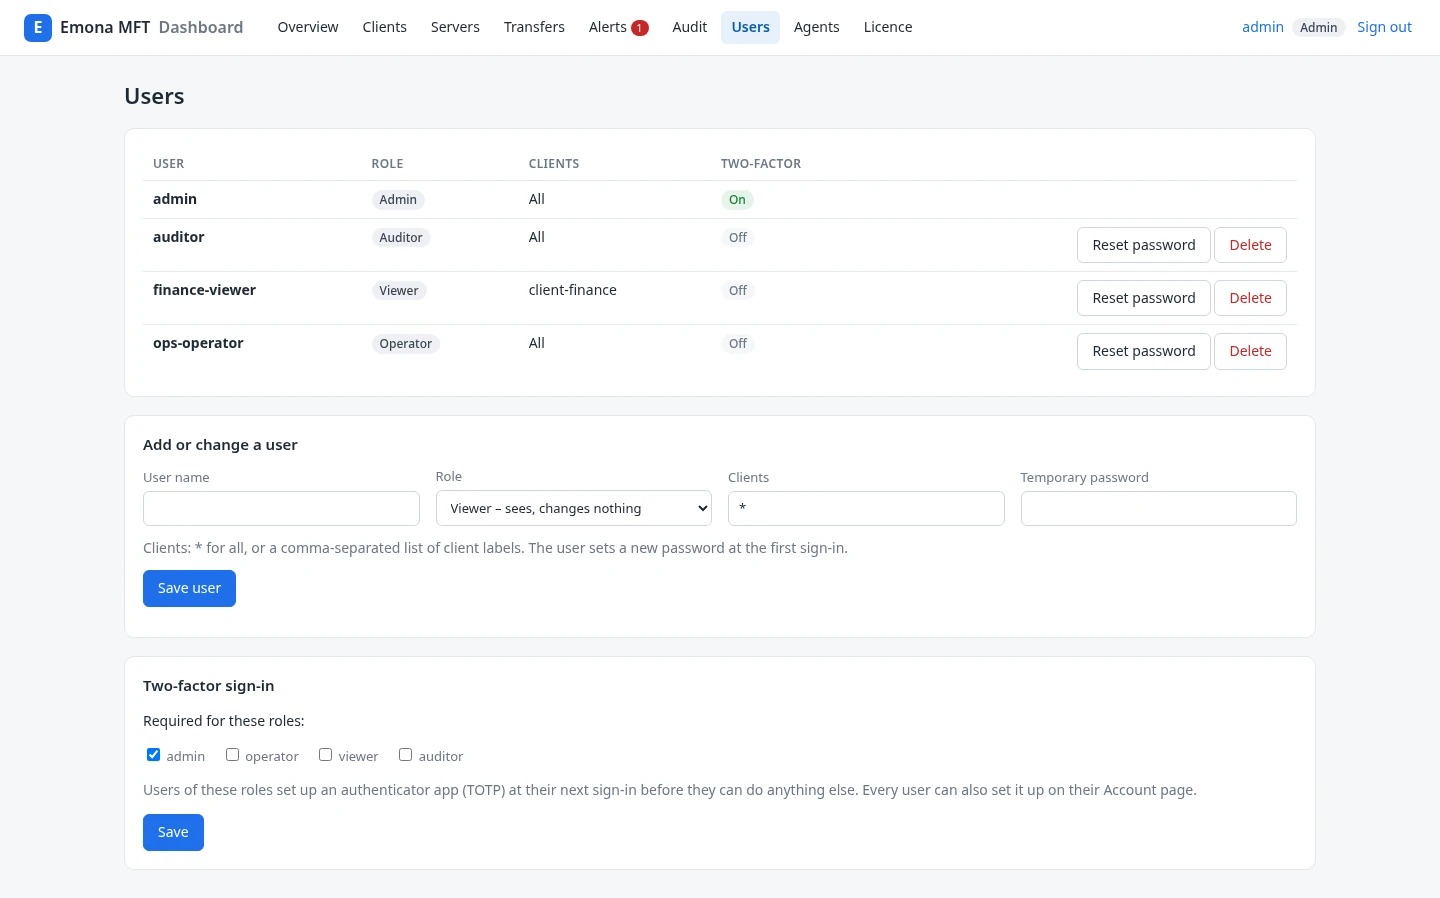
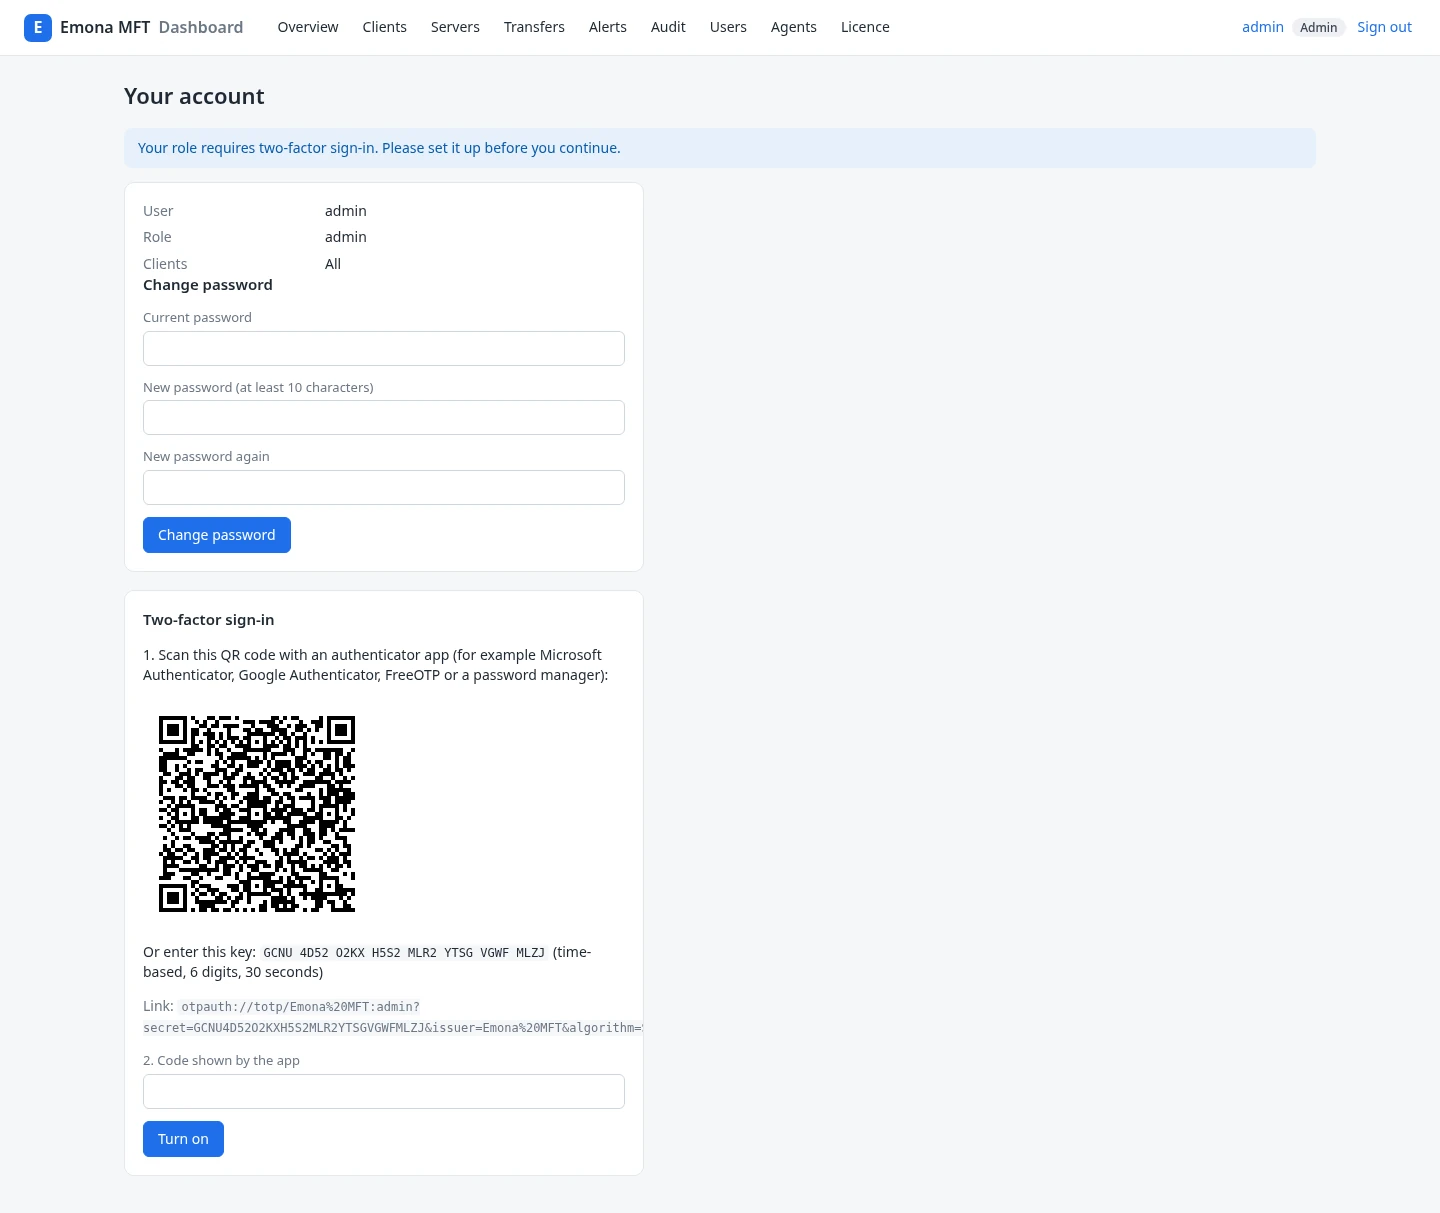
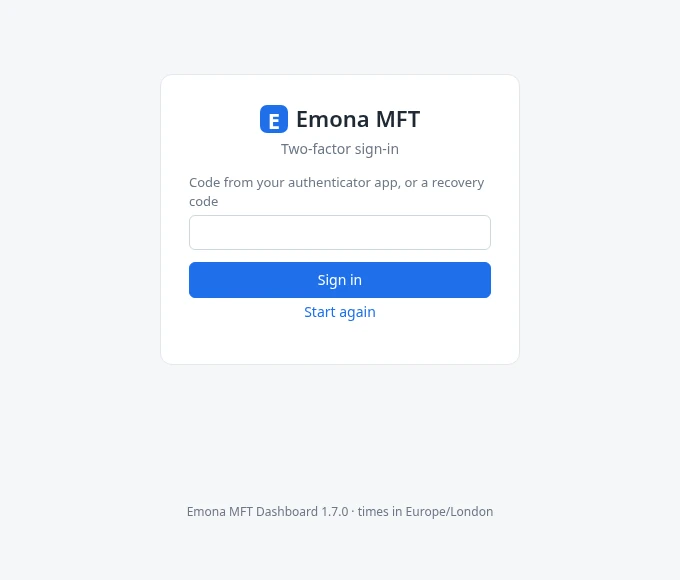
Real screenshots of the Emona MFT Dashboard 1.7.0, taken on a test machine with two demo servers, five demo clients and demo users. Select a screenshot to open it in full size.
Sign-in and phone
Event log and audit trail
Emona MFT servers and clients write a machine-readable event log: one JSON line per event, one file per day. It records every finished, refused or failed transfer with client, file name, size, SHA-256 hash, protocol and duration, plus starts and stops, an unreachable server and a missing source directory. Keys and file contents are never written to it.
- Linked to the real agent. The dashboard records each event under the agent id of the authenticated connection, so one server or client can't send events in the name of another. An agent's role and client label are fixed, only servers report transfers, and a client's events always count for its own label.
- Hash-chained audit log. Every sign-in, failed sign-in, user change, alert acknowledgement, alert note, export and licence change goes to the dashboard's audit log. Each line carries the SHA-256 hash of the line before it, so a line changed or removed in the middle of a file shows up.
- Seals. Event logs, the audit log and the incident register get seal lines every hour (configurable), at the end of each day and at stop. Compared with the copy in your SIEM, the seals also show lines removed at the end of a file and a recomputed chain.
- Hourly self-check. Servers, clients and the dashboard check their own hash chains when they open a file and every hour. A broken chain raises a critical alert: "Event log changed", "Audit log changed" or "Incident register changed".
- Verification. The Audit page shows the integrity of each daily file, marks sealed files and lets admins and auditors download them. A command-line check verifies any event, audit or incident file, optionally against the SIEM copy.
The logs are tamper-evident, not tamper-proof: someone with write access to the files can still change them. The seals make such a change visible when the files are compared with a copy kept elsewhere, so treat the copy in your SIEM as the authoritative one.
SIEM and syslog forwarding
- Every line to your SIEM. With
siem.hostset, the dashboard sends every event of all servers and clients and every audit line to your SIEM or log server as RFC 5424 syslog over UDP, TCP or TLS. - Nothing lost in an outage. Lines are read from the files and the position is saved, so lines written while the SIEM was down or the dashboard was restarted are sent afterwards. A SIEM that stops reading is detected, and the alert "SIEM forwarding failing" opens.
- Without the dashboard too. Servers and clients can send their own event lines to a syslog receiver directly.
- Ready-made searches. The documentation lists the events worth a rule, with example searches for Splunk, Elastic and Microsoft Sentinel.
Alerts
| Alert | When | Ends |
|---|---|---|
| Server / client not reporting | No heartbeat for 90 seconds (configurable) | When it reports again |
| Server stopped | The server was stopped | When it starts |
| Low disk space | Free space of a storage below the limit (1 GB by default) | When there is enough again |
| Failed client authentication | A server refused a client key or label | Acknowledged |
| Authentication failure burst (critical) | Many refused client connections on one server within a few minutes (20 in 5 minutes by default) | Acknowledged |
| Transfer failed | A transfer was refused or cut off | Acknowledged |
| Client can't reach its server | A client logged its server as unreachable | When it sends again |
| Dashboard link refused | An unknown agent or a wrong key tried to connect | Acknowledged |
| Many failed sign-ins | 20 wrong passwords for one user in 15 minutes | Acknowledged |
| Event log, audit log or incident register changed (critical) | A line no longer matches the hash chain | Acknowledged |
| Key file readable by other users | A server, client or the dashboard found a key file that other users can read | At the next start without it |
| Retention: file not deleted | A server couldn't delete a received file after its retention period | Acknowledged |
| SIEM forwarding failing | Lines couldn't be sent to the SIEM for 5 minutes (configurable) | When sending works again |
| SIEM copy incomplete | A log file was deleted by retention before all of it was sent | Acknowledged |
Each alert is sent once when it opens and once when it ends, by e-mail through your SMTP relay and to syslog (RFC 5424), if configured. Repeats are counted, not sent again. Operators and admins acknowledge alerts and add notes, for example what was found and done.
Incident register
Every alert is also an incident. The dashboard records each opening, reopening, acknowledgement, resolution and note, with the user and the state of the incident at that moment, in owner-only, hash-chained and sealed files kept for three years by default.
- For NIS2 reporting. The register gives the times (opened, acknowledged, resolved), who handled the incident, the notes and the history you need for an early warning, a notification or a final report (NIS2 Art. 21 and 23). Deciding whether an incident is significant and reporting it stays with you; nothing is sent to an authority.
- Export for a period. Admins and auditors export all incidents of a period as CSV or JSON on the Alerts page. Each export is recorded in the audit log.
Users, roles and sign-in
- Roles. Viewers see the pages they are allowed to see. Operators also acknowledge alerts and add notes. Admins also manage users, see the audit log and the agents, install the licence and export the incident register. Auditors, for internal or external auditors and data protection officers, see and download the audit log and export the incident register, but can't change anything. A user can be limited to some clients and then sees only those clients and their transfers.
- Two-factor sign-in. Every user can turn on sign-in codes from an authenticator app (TOTP: Google Authenticator, Microsoft Authenticator, Aegis, 1Password and others) by scanning a QR code, with 10 one-time recovery codes. Admins decide which roles must use it; new installations require it for admins.
- Single sign-on. Users can sign in through Microsoft Entra ID, Okta, Keycloak, Google Workspace, ADFS or any OpenID Connect provider (code flow with PKCE). Provider groups are mapped to roles and clients, and an SSO-only mode keeps local admins as a break-glass account.
- Passwords. At least 10 characters, stored as PBKDF2-SHA256 hashes. On the first start the dashboard creates an
adminuser with a random password, which must be changed at the first sign-in. - Lockout per user and address. After 5 wrong passwords or codes from one address, the user is locked for 15 minutes from that address only; from other addresses the user can still sign in.
- Throttling under attack. After 20 wrong passwords for one user from all addresses together, new browsers on new addresses share one checked try per 5 seconds for that user, which limits guessing to about 12 a minute however many addresses an attacker uses. Browsers and addresses the user signed in from before are still checked, so the right password still works.
- Behind a reverse proxy. Set
ui.trusted.proxyto the proxy's address, and the lockout counts each user address from itsX-Forwarded-Forheader. Without the setting the header is ignored. - Sessions and pages. Sessions end after 30 minutes without use. Cookies are HttpOnly and SameSite=Strict (and Secure on HTTPS), every form has a CSRF token, and pages are sent with a strict Content Security Policy and
X-Frame-Options: DENY.
Installation and limits
- Java 8u92 or newer on Linux, macOS or Windows, with Apache Log4j 2 as the only dependency. A heap of 256 MB is enough for the default settings.
- Local by default. The web interface listens only on 127.0.0.1 unless you configure otherwise. HTTPS works with your own keystore.
- Agent link. A key per agent, HKDF-SHA256 session keys and AES-256-GCM, so a recorded connection can't be replayed to the dashboard.
- Owner-only files. On Linux and macOS, everything the dashboard writes in its data folder is readable only by the account that runs it, and key files that other users can read are reported at start and as an alert.
- Licence checked offline. The licence file from BLUEGEM is signed and checked without any internet connection. Emona MFT servers and clients never stop or change behaviour because of the dashboard licence.
- Built for slow connections. The web server closes connections that have not sent a complete request within 5 seconds and adds threads as needed, up to about 1,000 slow connections at a time. If the dashboard can be reached from the internet, put a reverse proxy (nginx, Apache, IIS) in front of it.
- CSV exports. At most two downloads in progress per user, with a configurable limit on the temporary space they use, so one account can't fill the disk.
- E-mail. Alerts are sent through an SMTP relay without TLS, so use a relay on your local network.